Zoraxy — Reverse Proxy

Updated 23 September 2026. This replaces the earlier version of this post: the security model has changed completely. The weekly forensic script has been demoted to reporting only, and blocking is now automatic via a plugin I wrote for Zoraxy.
If you've spent any time self-hosting at home you've hit the same wall I did: one public IP address, a dozen services you want to reach from the internet, and the question of how to route it all cleanly. That's what a reverse proxy solves, and Zoraxy is the one I've settled on.
What Is Zoraxy
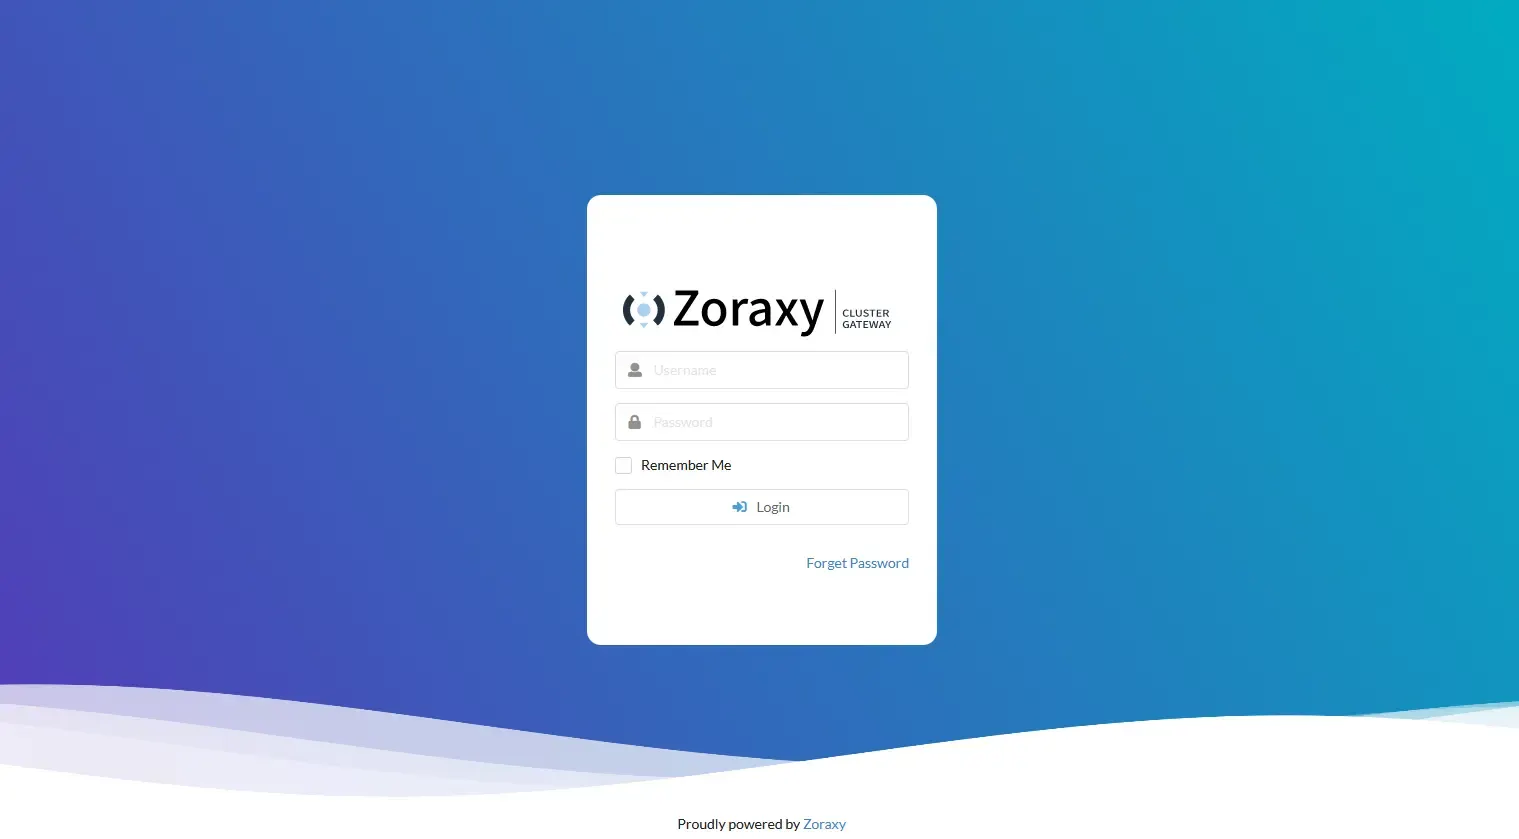
Zoraxy is an open-source, general-purpose HTTP reverse proxy written in Go by Toby Chui. Unlike the more established options — Nginx Proxy Manager, Caddy, Traefik — it was built to be approachable. The repo describes it as being for "networking noobs", which is accurate and also undersells it: it's a fully-featured reverse proxy with a clean web UI that doesn't require you to touch a config file to get started.
At its core it does what every reverse proxy does — sits in front of your services and forwards inbound traffic to the right backend based on the hostname. One port 443, one public IP, routing cleanly to dozens of services.
What makes it genuinely useful in a homelab:
- TLS with ACME automation. Let's Encrypt issuance and renewal natively, including DNS-01 for wildcardcertificates. Wildcards apply automatically to any matching proxy rule — no per-host certificate assignment.
- WebSocket proxying that just works. No
Upgrade/Connectionheader archaeology. This sounds minor until you've lost an afternoon to a frontend that keeps dropping its connection. - Access control at the proxy layer. IP blacklists and whitelists (single IPs, CIDR, wildcards), country blocking, and basic auth per host — gating tools without touching the service's own auth.
- Built-in exploit blocking. Detection for common attack patterns — path traversal, bad user agents, probe strings — logged and returned as a 403.
- Uptime monitoring, a static file server, and TCP/UDP stream proxying for the odd non-HTTP service.
- A plugin system — Forward Auth (Authelia, Authentik), OAuth2, reCAPTCHA, and anything you care to write yourself. More on that below, because that's where this post has changed the most.
Pros
- Dead simple to start. Add a host, set the target, save. No YAML, no label syntax, no container restarts.
- Wildcard certificates that actually work, including DNS-01 without exposing port 80.
- One place for security. All inbound traffic passes one point, so access control and exploit detection are configured once rather than per service. Thats not entirely true.
- Lightweight. Go binary, near-instant start, trivial resource use.
- Self-contained. One database file and a certificate directory. Backup is a single tar.
Cons
- WebSocket deadline bug. A hardcoded 5-minute timeout closes WebSocket connections regardless of activity (upstream issue #1159). In practice: media and dashboard frontends go stale. Not a misconfiguration.
- Single instance, single admin. No clustering or multi-node sync. Fine for a homelab; know it before you plan something bigger.
- Limited API. Most configuration is UI-only, which is painful for bulk changes.
- Basic static file server. Fine for a
robots.txt, not a web server. - Exploit detection false positives. URL-encoded characters in legitimate admin API calls get flagged, which is noise rather than danger — but it's noise you have to filter in reporting.
- Single point of failure. Everything external funnels through one container.
How Zoraxy Fits Into the Network
The shape is more useful than my specific addresses, so here it is generally.
A Proxmox hypervisor runs a small dedicated Debian LXC container for the proxy. Application workloads live in separate containers — a mix of Podman and Docker stacks — on their own hosts. The firewall / router handles VLAN segmentation.
All external traffic reaches Cloudflare first. Cloudflare is the first layer of defence: WAF rules dropping known scanner subnets, crawlers and automated probes before a packet gets near the network. A Cloudflare tunnel runs on the proxy container, so the public port 443 never touches the router's WAN interface. Cloudflaret erminates TLS, applies its rules, and forwards what survives over an authenticated tunnel.
This blocks a majority of the undesirable probing but not all of it.
Zoraxy then applies its own layer — IP and country rules, rate limiting, exploit detection — before forwarding to the right backend. It also terminates TLS internally with wildcard certificates, so traffic stays encrypted on the LAN.
Two layers, clear division of labour: Cloudflare filters the internet, Zoraxy filters what Cloudflare passes through.
One thing worth flagging, because it silently defeats the second layer and it caught me out. Behind a tunnel, the proxy sees connections coming from itself — the tunnel daemon relays them locally. Unless the tunnel's address is in Zoraxy's trusted proxies list and "Trust proxy headers only" is enabled on each access rule,
Zoraxy judges rules against its own address, not the visitor's. A country whitelist then waves everyone through and IP blacklists never match anything. It looks like it's working. It isn't. Worse, Cloudflare-side protection keeps working perfectly, so nothing looks wrong.
Test it deliberately:
curl -sk -o /dev/null -w '%{http_code}\n' --resolve <host>:443:<proxy-ip> \
     -H 'CF-Connecting-IP: 8.8.8.8' https://<host>/
On a country-restricted host that must return 403. If it returns 200, your access rules aren't doing anything for tunnel traffic.
So you need to get this right. Live and learn.
The Scripts
Find below the forensic script that runs against the logs which in turn is processed by an AI. This generates a report which I will attach later (need to do the school run and get on my treddly).
#!/bin/bash

################################################################################
# Zoraxy Forensic Report Generator
# Version: 2.7.0
# Created: 2026-04-22
# Revised: 2026-09-18
#
# Description:
#   Generates a forensic security report from the current month's Zoraxy Proxy log.
#   Deliberately does NOT filter out internal/LAN traffic - full logs are kept intact for forensic completeness,
#   since this report is shared publicly with cybersecurity professionals and partial data would limit its value.
#   Internal vs external traffic is instead labelled (not dropped) in the "By IP" breakdown - see v2.7.0 notes below.
#   Saves the report to a file and emails it to the security team via postfix as an attachment. The attachment filename matches the timestamped report filename on disk.
#
# Report cadence (by design, not a bug):
#   This runs weekly but always reads the CURRENT MONTH's log file in full, so consecutive weekly reports are cumulative month-to-date snapshots,
#   not independent 7-day windows - a report generated on the last Sunday of a month covers nearly the whole month.
#   This is intentional: one log file per month, reports regenerated/re-sent as needed against it. Do not "fix" this into a rolling 7-day window without checking first.
#
# Report retention (manual, by design):
#   /srv/zoraxy/reports/ is never pruned by this script. Old reports
#   accumulate indefinitely. This is intentional (manual review before
#   deletion) but requires periodic manual cleanup - there is no automated
#   retention policy.
#
# Setup / Installation:
#   1. Copy this script to /usr/local/bin/:
#        cp forensic-report.sh /usr/local/bin/forensic-report.sh
#
#   2. Set correct permissions:
#        chmod 700 /usr/local/bin/forensic-report.sh
#        chown root:root /usr/local/bin/forensic-report.sh
#
#   3. Create the reports output directory (first run only):
#        mkdir -p /srv/zoraxy/reports
#        chown root:root /srv/zoraxy/reports
#        chmod 700 /srv/zoraxy/reports
#
#   4. Schedule via cron (runs every Sunday at 2300hrs):
#        crontab -e
#        Add the following line:
#        0 23 * * 0 /usr/local/bin/forensic-report.sh
#
# Key Changes in v2.7.0:
#   - Removed: the LANIP internal-traffic filter.
#     Full, unfiltered logs are the deliberate choice going forward - internal traffic is kept, not
#     dropped, since this report is meant to be a complete forensic record.
#   - Added: "External Requests by IP" now splits results into LAN and WAN/External sub-lists rather than one commingled ranked list.
#     Internal traffic outnumbers external ~30:1 in a typical month, which was burying the externally-relevant signal in an unfiltered report.
#     Nothing is dropped - this is a readability split, not a filter. IPv4 LAN match is 192.168.0.0/16.
#     IPv6 LAN match is detected fresh from this host's own live global address at run time (first /48) rather than hardcoded,
#     since LAN devices get real globally-routable IPv6 addresses (no NAT) and the delegated prefix can rotate - this self-adjusts on every run with no
#     maintenance required. If no global IPv6 address is present on this host at run time, IPv6 entries are listed as unclassified rather than guessed.
#   - Added: "Rate-Limited Requests (429) by Client IP" - router:ratelimit log entries carry an empty [origin:] field (Zoraxy's rate limiter is
#     global, not per-host), so all 429s were previously invisible to every origin-grouped section in this report despite being one of the more
#     operationally relevant signals available. Grouped by client instead, matching the existing Top Exploit Origins pattern below.
#   - Added: "Blocked by IP/Geo Whitelist" - router:whitelist rejections (Zoraxy's IP/geo allowlist enforcement).
#     Low volume by design, so listed as individual events rather than aggregated into a count table, which would compress a handful of events into near-nothing useful.
#   - Fixed: Top Exploit Origins was printing every client IP with a stray trailing "]" (the [client: ...] extraction split on whitespace instead
#     of anchoring on the actual field boundary). Same pattern reused for the new Rate-Limited section above, fixed there from the start.
#
# Key Changes in v2.6.0:
#   - Added: Status code distribution by origin — identifies which proxied services are generating errors, critical for distinguishing attacks from
#     operational noise (e.g. Pulse 401 flood vs credential stuffing attack)
#   - Added: Top 401 origins — surfaces credential attack patterns and service authentication misconfigurations in a single view
#   - Added: Top 502/521 origins — identifies failing backend targets by
#     service name rather than requiring manual log grep
#   - Added: Top exploit origins — shows which external IPs are responsible for the most exploit/probe attempts, not just the raw log lines
#   - Fixed: Suspicious URLs section was outputting HTTP status codes rather than request paths due to $NF matching the last field in Zoraxy's log
#     format (which is the status code). Now correctly extracts the request URI using the GET/POST verb as an anchor.
#   - Improved: Exploit detection patterns expanded to cover SSRF attack vectors observed in September 2026: cloud metadata endpoint
#     (169.254.169.254), file:// protocol, Azure credential paths, and Spring Boot actuator endpoints (/actuator/env).
#   - Improved: HTTP error section now uses origin-aware extraction matching Zoraxy's actual log format rather than positional field parsing.
#
# Key Changes in v2.5.1:
#   - Fixed: LANIP placeholder "[IP_ADDRESS]" was being interpreted as a regex character class by grep, silently wiping most log lines and producing a
#     blank report. LANIP filter is now skipped when the placeholder value is unchanged, making the script safe to run before configuration.
#   - Fixed: LANIP is now validated as a non-empty, non-placeholder value before being applied as a grep filter; a warning is printed when skipped.
#
# Key Changes in v2.5.0:
#   - Fixed: email attachment filename now matches the timestamped report filename on disk (e.g. forensic-report-2026-09-05_16-32-55.txt)
#     rather than the static "forensic-report.txt"
#   - Added: "Created" date to header (original script creation date)
#   - Added: "Revised" date to header (tracks most recent update)
#
# Key Changes in v2.4.0:
#   - Fixed: script no longer continues and emails an empty report when the current month's log file is missing; now exits with an error instead
#   - Fixed: HTTP error section now correctly extracts the status code field from Zoraxy log lines rather than using $NF (last field)
#   - Fixed: temp file protected by trap to ensure cleanup on unexpected exit
#   - Fixed: install path corrected to /usr/local/bin throughout
#   - Fixed: cron expression corrected to "0 23 * * 0" (every Sunday at 2300)
#   - Improved: exploit detection pattern expanded to catch encoded path traversal and injection probe strings
#
# Key Changes in v2.3.0:
#   - Added timestamp to report file name and email subject
#
# Requirements:
#   - Postfix configured and running
#   - Access to Zoraxy logs directory (/srv/zoraxy/log)
#   - sendmail available at /usr/sbin/sendmail
#
# Usage:
#   /usr/local/bin/forensic-report.sh
#
################################################################################

LOGDIR="/srv/zoraxy/log"
REPORT_TIMESTAMP="$(date '+%Y-%m-%d_%H-%M-%S')"
REPORT_FILE="/srv/zoraxy/reports/forensic-report-${REPORT_TIMESTAMP}.txt"
REPORT_FILENAME="$(basename "$REPORT_FILE")"
EMAIL_TO="[your email address]"
EMAIL_FROM="zoraxy-forensics@$(hostname -f)"
EMAIL_SUBJECT="Zoraxy Forensic Report - $(date '+%Y-%m-%d %H:%M:%S')"

# Determine current month's log file (Zoraxy naming format: zr_YYYY-M.log)
CURRENT_LOG="$LOGDIR/zr_$(date '+%Y-%-m').log"

# Function to generate report
generate_report() {
    echo
    echo "==============================================="
    echo "        ZORAXY OFFLINE FORENSIC SUMMARY"
    echo "==============================================="
    echo "Generated: $(date '+%Y-%m-%d %H:%M:%S')"
    echo "Hostname: $(hostname)"
    echo "Log file: $CURRENT_LOG"
    echo

    # Abort if the current month's log does not exist
    if [ ! -f "$CURRENT_LOG" ]; then
        echo "ERROR: No log found for current month: $CURRENT_LOG"
        echo "Aborting report generation."
        return 1
    fi

    echo "Log found:"
    echo "$CURRENT_LOG"
    echo

    # Create temp file and ensure it is cleaned up on any exit
    FILTERED=$(mktemp)
    trap "rm -f '$FILTERED'" EXIT

    # No internal/LAN filtering - full logs are kept intact for forensic
    # completeness (see header notes). Only known browser-UI/asset noise is
    # dropped, regardless of source.
    grep -v "netstatgraph" "$CURRENT_LOG" \
    | grep -v "summary?fast" \
    | grep -v "snippet" \
    | grep -v "script/" \
    | grep -v "darktheme" \
    > "$FILTERED"

    # Detect this host's own LAN IPv6 /48 fresh on every run (not hardcoded) -
    # SLAAC gives LAN devices real globally-routable IPv6 addresses (no NAT),
    # and the delegated prefix can rotate on a router restart. Falls back to
    # "unclassified" if no global IPv6 address is present at run time rather
    # than guessing. This is a readability heuristic for the "by IP" split
    # below, not a security boundary - a /48 is deliberately wide enough to
    # also cover sibling VLANs sharing the same delegation.
    LAN_IPV6_PREFIX=$(ip -6 addr show scope global 2>/dev/null \
        | awk '/inet6/ {print $2}' \
        | grep -viE '^(fe80|fc|fd)' \
        | head -1 \
        | cut -d'/' -f1 \
        | awk -F: '{print $1":"$2":"$3}')

    echo "-----------------------------------------------"
    echo " External Requests by IP"
    echo "-----------------------------------------------"
    # Split into LAN and WAN/external rather than one commingled ranked list -
    # internal traffic outnumbers external roughly 30:1 in a typical month,
    # which buries the externally-relevant signal in an unfiltered report.
    # Nothing is dropped here, only grouped for readability.
    ALL_CLIENTS=$(grep -Eo "client: [^]]+" "$FILTERED" | awk '{print $2}')

    echo "  -- LAN (192.168.0.0/16$( [ -n "$LAN_IPV6_PREFIX" ] && echo ", ${LAN_IPV6_PREFIX}::/48" )) --"
    if [ -n "$LAN_IPV6_PREFIX" ]; then
        echo "$ALL_CLIENTS" | grep -E "^192\.168\.|^${LAN_IPV6_PREFIX}:" | sort | uniq -c | sort -nr
    else
        echo "$ALL_CLIENTS" | grep -E "^192\.168\." | sort | uniq -c | sort -nr
        echo "  (no global IPv6 address on this host at run time - IPv6 LAN match skipped)"
    fi
    echo
    echo "  -- WAN / External --"
    if [ -n "$LAN_IPV6_PREFIX" ]; then
        echo "$ALL_CLIENTS" | grep -vE "^192\.168\.|^${LAN_IPV6_PREFIX}:" | sort | uniq -c | sort -nr
    else
        echo "$ALL_CLIENTS" | grep -vE "^192\.168\." | sort | uniq -c | sort -nr
    fi
    echo

    echo "-----------------------------------------------"
    echo " Suspicious User Agents"
    echo "-----------------------------------------------"
    grep -v "Mozilla/5.0" "$FILTERED" \
    | grep -Eo "useragent: [^]]+" \
    | awk -F'useragent: ' '{print $2}' \
    | sort | uniq -c | sort -nr
    echo

    echo "-----------------------------------------------"
    echo " HTTP Status Code Distribution"
    echo "-----------------------------------------------"
    # Extracts the trailing status code from Zoraxy log lines.
    # Zoraxy format ends with: GET /path STATUS or POST /path STATUS
    grep -Eo "(GET|POST|PUT|DELETE|HEAD|OPTIONS|PATCH) [^ ]+ [0-9]{3}" "$FILTERED" \
    | awk '{print $NF}' \
    | sort | uniq -c | sort -nr
    echo

    echo "-----------------------------------------------"
    echo " HTTP Errors (4xx / 5xx) by Origin"
    echo "-----------------------------------------------"
    # Groups error responses by proxied service (origin) — critical for
    # distinguishing attacks from service misconfigurations.
    grep -E "(GET|POST|PUT|DELETE|HEAD|OPTIONS|PATCH) [^ ]+ [45][0-9]{2}$" "$FILTERED" \
    | grep -oP '\[origin:[^\]]+\]' \
    | sort | uniq -c | sort -nr \
    | head -20
    echo

    echo "-----------------------------------------------"
    echo " Top 401 Origins (Authentication Failures)"
    echo "-----------------------------------------------"
    # High 401 counts from a single origin indicate either a credential attack
    # or a misconfigured service (e.g. lost API token polling in a loop).
    grep -E "(GET|POST|PUT|DELETE|HEAD|OPTIONS|PATCH) [^ ]+ 401$" "$FILTERED" \
    | grep -oP '\[origin:[^\]]+\]' \
    | sort | uniq -c | sort -nr \
    | head -10
    echo

    echo "-----------------------------------------------"
    echo " Top 502 / 521 Origins (Backend Failures)"
    echo "-----------------------------------------------"
    # Identifies which proxied services are generating backend connectivity
    # errors — distinguishes a single failing target from systemic issues.
    grep -E "50[12]|521" "$FILTERED" \
    | grep -oP '\[origin:[^\]]+\]' \
    | sort | uniq -c | sort -nr \
    | head -10
    echo

    echo "-----------------------------------------------"
    echo " Rate-Limited Requests (429) by Client IP"
    echo "-----------------------------------------------"
    # router:ratelimit entries carry an empty [origin:] field (Zoraxy's rate
    # limiter is global, not per-host), so these are invisible to every
    # origin-grouped section above despite being a genuinely useful signal -
    # a single client hammering the rate limit is worth knowing about.
    # Grouped by client instead, matching Top Exploit Origins below.
    grep "\[router:ratelimit\]" "$FILTERED" \
    | grep -oP '\[client: \K[^\]]+' \
    | sort | uniq -c | sort -nr \
    | head -10
    echo

    echo "-----------------------------------------------"
    echo " Exploit / Probe Attempts"
    echo "-----------------------------------------------"
    # Matches common probe and injection patterns including:
    #   - Path traversal (../, encoded variants)
    #   - Shell/script/SQL injection
    #   - SSRF: cloud metadata endpoint, file:// protocol, Azure credential paths
    #   - Spring Boot actuator endpoint probing (/actuator/env)
    #   - Credential file paths (.env variants, .aws/credentials)
    grep -iE "(exploit|\.\./|%2e%2e|cmd=|exec=|eval\(|<script|union.*select|/etc/passwd|/bin/sh|wget |curl |169\.254\.169\.254|file%3a%2f%2f|file://|\.azure/credentials|\.azure/accessTokens|/actuator/env|/actuator/|\.env\.backup|\.env\.prod|dump\.sql|terraform\.tfstate)" "$FILTERED" \
    || echo "None detected"
    echo

    echo "-----------------------------------------------"
    echo " Top Exploit Origins"
    echo "-----------------------------------------------"
    # Shows which external IPs are responsible for the most exploit attempts —
    # useful for WAF block prioritisation.
    grep -iE "(exploit-blocked)" "$FILTERED" \
    | grep -oP '\[client: \K[^\]]+' \
    | sort | uniq -c | sort -nr \
    | head -10
    echo

    echo "-----------------------------------------------"
    echo " Blocked by IP/Geo Whitelist"
    echo "-----------------------------------------------"
    # Zoraxy's IP/geo allowlist rejections. Low volume by design (a narrowly-
    # scoped allowlist, not a general filter), so listed as individual events
    # rather than aggregated - a handful of raw events are more useful here
    # than a count-by-IP table would be. Useragent is dropped for brevity.
    grep "\[router:whitelist\]" "$FILTERED" \
    | sed -E 's/ \[useragent:[^]]*\]//' \
    || echo "None detected"
    echo

    echo "-----------------------------------------------"
    echo " Suspicious Request Paths (top 20)"
    echo "-----------------------------------------------"
    # Extracts the request URI (path + query) from GET/POST lines.
    # Fixed from v2.5.x which incorrectly extracted the status code via $NF.
    grep -E "(GET|POST|PUT|DELETE|HEAD|OPTIONS|PATCH)" "$FILTERED" \
    | grep -oP '(GET|POST|PUT|DELETE|HEAD|OPTIONS|PATCH) \K[^ ]+(?= [0-9]{3})' \
    | grep -v "^/$" \
    | sort | uniq -c | sort -nr \
    | head -20
    echo

    echo "-----------------------------------------------"
    echo " Summary Complete"
    echo "-----------------------------------------------"
    echo
}

# Generate report and save to file; abort cleanly if generation fails
generate_report > "$REPORT_FILE" 2>&1
if [ $? -ne 0 ]; then
    echo "Error: Report generation failed (check log path or permissions)."
    echo "Partial report (if any) saved to: $REPORT_FILE"
    exit 1
fi

# Send email with report as MIME attachment; filename matches the on-disk report filename
(
    echo "To: $EMAIL_TO"
    echo "From: $EMAIL_FROM"
    echo "Subject: $EMAIL_SUBJECT"
    echo "MIME-Version: 1.0"
    echo "Content-Type: multipart/mixed; boundary=\"BOUNDARY\""
    echo ""
    echo "--BOUNDARY"
    echo "Content-Type: text/plain; charset=UTF-8"
    echo ""
    echo "Zoraxy forensic report attached."
    echo "Generated on $(hostname) at $(date '+%Y-%m-%d %H:%M:%S')"
    echo ""
    echo "--BOUNDARY"
    echo "Content-Type: text/plain; charset=UTF-8"
    echo "Content-Disposition: attachment; filename=\"$REPORT_FILENAME\""
    echo ""
    cat "$REPORT_FILE"
    echo ""
    echo "--BOUNDARY--"
) | /usr/sbin/sendmail -t

# Report on email dispatch result
if [ $? -eq 0 ]; then
    echo "Forensic report generated and emailed to $EMAIL_TO"
    echo "Report saved to: $REPORT_FILE"
else
    echo "Error: Failed to send email via sendmail."
    echo "Report saved to: $REPORT_FILE"
    exit 1
fi

# End of script
The script is still useful mainly to see what is going on and provides data to the AI.
The AI is obviously now aware that the plugin (see below) exists.
It also provides information on faults within the Zoraxy logs that may occur due to misconfigured services deployed within it.
The Zoraxy Cloudflare WAF Plugin
I couldn't find a tool that did what I wanted, so I wrote one:
zoraxy-cloudflare-waf (MIT).
The forensic reports told me exactly who was attacking me — a week later. The plugin closes that gap. It watches the same access log the reports parse, and it acts in seconds instead of days.
What it does
The plugin flags a client IP three ways:
- Exploit patterns in the request line — path traversal,
/etc/passwd, actuator endpoints. - Sensitive-path probes — requests for things only a scanner asks for:
/.git/,/.env, cloud and tooling credential directories (.aws,.docker,.kube,.ssh), credential dotfiles (.netrc,.npmrc,.DS_Store), credential-named JSON/YAML files and SSH keys. Regardless of the response status. - Error-rate bursts — more than N 4xx/5xx responses inside a window.
That second rule exists because of something the dry run exposed. Single-page apps answer any path with 200 and their index page, so a scanner sweeping them never generates the errors the threshold rule counts. Over a 38-hour dry run, the error-rate rule alone caught 8 scanner IPs and missed 9 more that were sweeping the SPA hosts. The path rules catch both.
Once flagged, the IP is added to a Cloudflare IP List referenced by a single custom WAF rule — so unlimited IPs behind one rule slot rather than one rule per address — and, optionally, to Zoraxy's own access-rule blacklist as a second layer. Blocks expire automatically (default 14 days), because scanners use rented cloud addresses that get recycled to legitimate services, and a permanent block slowly becomes a false positive.
Deliberately narrow: bare .php, phpinfo, wp-* and config.json are not triggers. Legitimate sites use those, and a false positive locks an operator out of their own site. /.well-known/ never matches.
Raw data
What it actually says when it catches something:
action: blocked ip=34.44.90.208 source=logtail
  reason="sensitive-path probe (dotenv): /.ENV"
  detail="cloudflare: ok; zoraxy: banned in 2 access rule(s)"
Proof of life on a quiet night — it says so rather than staying silent, so "running with nothing to do" is distinguishable from "not running":
logtail: alive - following zr_2026-9.log, 98543 lines read, 19 candidates raised since start
expiry: checked 10 Cloudflare list item(s), 10 added by this plugin, none older than 14 days
Since going live on 21 September, 26 IPs blocked, by category:
| Detection | Blocks |
|---|---|
VCS metadata (/.git/…) |
10 |
Credential dotfiles (.netrc, .DS_Store, …) |
5 |
Cloud/tool directories (.docker, .kube, …) |
3 |
.env files |
3 |
| Credential-named files | 2 |
| Zoraxy blacklist events (relayed) | 3 |
The paths they actually asked for, straight from the access log:
/.git/config      /.git-credentials    /.netrc        /.docker/config.json
/.kube/config     /server-status       /info.php      /test.php
Some of these are busy: one blocked scanner had made 231 requests, another 184. And they're topical — /.claude/credentials.json and /.codex/auth.json both showed up. The attackers have noticed which tools developers are installing.
A 12.7-hour window with both layers live: 15 blocks, all genuine scanners, zero false positives, zero misses (no public IP hit a detection rule without being blocked), zero errors, about 11 MB of memory and no measurable CPU. Cloudflare's own counter showed 262 hits on the managed rule. Six of nine blocked IPs in an earlier window never came back at all; the rest stopped within seconds of the list updating.
Someone is watching and adapting. Nice to be noticed.
Automation
The point is that none of this needs me:
- Detection to enforcement is automatic. No weekly report, no copying IPs into a dashboard. The first real block created the IP List and the WAF rule by itself.
- Two layers, independently. If Cloudflare fails and Zoraxy succeeds (or vice versa) the action is logged as
partialwith the failing side's reason, rather than silently half-applied. - Blocks expire on their own, so the list doesn't grow forever.
- It's honest about failure. The first live attempt hit an account limit on Cloudflare lists and stopped without writing anything else, then said exactly what was wrong and how to fix it. Which is what you want from something that mutates a production firewall unattended.
- Safety first. Other people's WAF rules are never re-sent, a failed read never leads to a write, and a rule it didn't create is never modified. That behaviour is unit-tested against fake Cloudflare and Zoraxy servers.
It ships inert — disabled, dry-run on. You watch what it would do before letting it do anything. v0.3.0 is released with amd64, arm64, ARMv7 and 386 builds, and it's submitted to the official Zoraxy plugin store.
Conclusions
Was there a breach? No.
Do I have better visibility? Substantially. The weekly forensic report showed me what happened. The plugin shows me what's happening, in the journal, as it happens — and then does something about it. Both still matter: the report is the analysis, the plugin is the reflex.
What changed practically:
- Blocking is automatic and takes seconds, not a week.
- Detection covers the SPA blind spot that the error-rate approach missed entirely.
- Blocks expire, so the blocklist stays current instead of accumulating stale cloud IPs.
- Enforcement happens at Cloudflare's edge — attackers don't reach the proxy at all — with Zoraxy's own blacklist as a local backstop.
- One genuine surprise: a misconfigured trusted-proxy setup had been quietly nullifying my country rules for tunnel traffic. Worth checking on your own setup.
And Zoraxy itself? Not the most powerful reverse proxy available, and it has rough edges. But for a homelab running dozens of services on a single public IP, the combination of simplicity, TLS automation, a security layer that tells you what it's doing, and a plugin system open enough to let me bolt on exactly what was missing — it's very hard to argue with. It's a very nice reverse proxy.
I have learnt heaps doing this project, and when you think about opening that brand new service to the internet so you can use it when you are away. Have a long hard think. Securing this stuff is incredibly difficult.
No I wasnt thinking about writing a plugin. But I got tired of chasing my tail.
Radware 2026 Global Threat Report
Attachment — Radware Threat Report 2026 (PDF, ~4 MB). Paywall handled, so you can just read it.
Worth your time, because it's the "why" behind everything above. Edge protection isn't paranoia: the scanning is constant, automated and indiscriminate. Nobody chose my domains. They're simply in the address space, and someone's bot sweeps the address space continuously looking for a .git directory, an exposed .env, or a credential file someone left in a web root.
The traffic in this post is the small end of that same activity. Four hosts sweeping for .DS_Store seven seconds apart isn't a person — it's infrastructure. The only realistic answer is infrastructure that responds automatically, at the edge, before the request reaches anything that matters.
Until the next report then.
#enoughsaid